
In today’s competitive market, understanding the trends and statistics of advertising spend is crucial for businesses looking to optimize their marketing strategies. This article aims to provide insights into the average ad spend across various industries as well as projections for 2023.
Additionally, we’ll discuss industry-specific data on advertising expenditures and highlight key benchmarks that can help marketing teams make informed decisions moving forward.
Average Budgets for Digital Advertising vs. Traditional Advertising
Digital advertising encompasses online channels such as search engines, social media platforms, email campaigns, display ads on websites or apps, and video streaming services like YouTube or Hulu. On the other hand, traditional advertising includes print (newspapers/magazines), broadcast (TV/radio), and outdoor (billboards/bus shelters).
The shift from traditional to digital mediums has been evident over recent years; however, Statista reports that global digital ad spending surpassed traditional ad spend for the first time in 2023 at $333 billion compared to $316 billion, respectively. In 2023 alone, Magna Global estimates a total of $656 billion was spent globally on all forms of advertising, with digital advertising accounting for 64.4% of the total spend.
As businesses adjust their promotional strategies in light of changes to customer conduct and tech progress, it’s essential to factor these developments into account when designating funds for advertising efforts. The digital ad market has seen the highest growth in recent years, and it’s crucial to invest in digital ad spending to stay competitive.
According to a recent report published by eMarketer (source), global digital ad spending reached $389 billion in 2023 compared to only $234 billion spent on traditional formats – representing a significant shift in favor of internet-based platforms over their counterparts.
- Digital Ad Spend: $389 Billion (62%)
- Traditional Ad Spend: $234 Billion (38%)
This trend indicates that businesses are increasingly recognizing the potential of digital channels to target specific audiences, measure campaign performance, and optimize ad spending for better results. As you plan your marketing budget for 2023, it is essential to consider these market trends and allocate resources accordingly.
In recent years, the advertising landscape has evolved significantly, with a growing emphasis on digital advertising over traditional methods. Understanding the differences between these two approaches and their respective budgets is crucial for marketing teams looking to allocate resources effectively.
Digital Advertising
Digital advertising encompasses all promotional efforts made through online channels such as search engines, social media platforms, websites, and mobile apps. In 2023, global digital ad spending reached an estimated $389 billion USD, surpassing traditional ad spending by a significant margin. This trend can be attributed to factors like increased internet penetration rates worldwide and advertisers’ ability to target specific audiences more accurately using data-driven strategies.
Traditional Advertising
Traditional advertising, on the other hand, refers to offline promotional activities that include print ads in newspapers or magazines; broadcast advertisements on television or radio; outdoor billboards; direct mail campaigns; and event sponsorships. Despite its declining share of total ad budgets compared to digital alternatives, traditional advertising still accounted for approximately $225 billion USD in 2023 globally.
- Digital Ad Spend (2023): $389 billion USD
- Traditional Ad Spend (2023): $225 billion USD
The shift toward digital channels is expected to continue in the coming years, with experts predicting that digital ad spending will experience the highest growth at a compound annual growth rate (CAGR) of 10.9% between 2023 and 2026 (source). This growth is driven by factors such as increased mobile device usage, advancements in programmatic advertising technology, and the rise of new platforms like TikTok and Meta’s metaverse.
Comparing Digital vs Traditional Advertising Budgets
In 2023, Zenith Media’s report suggests that for every dollar spent on advertising globally, approximately 58 cents were allocated to digital channels while only 42 cents went toward traditional mediums. This trend is expected to continue as advertisers increasingly prioritize online platforms over offline methods.
With advancements in technology and consumer behavior shifting toward online consumption of content, it’s crucial for marketing teams and businesses alike to stay ahead of these market trends when planning their ad budgets for future campaigns. Keeping up with the highest growth areas of the digital ad market is key to staying competitive in the advertising market.
Digital advertising budgets are expected to continue increasing in 2023, but traditional advertising will still play a role for certain industries. To better understand where companies should focus their ad spend this year, let’s look at the industry-specific trends in advertising spending already in 2023.
Retail Industry
- Digital Display: $32.17 billion
- TV: $23.77 billion
- Newspapers: $8.47 billion
- Magazines: $4.15 billion
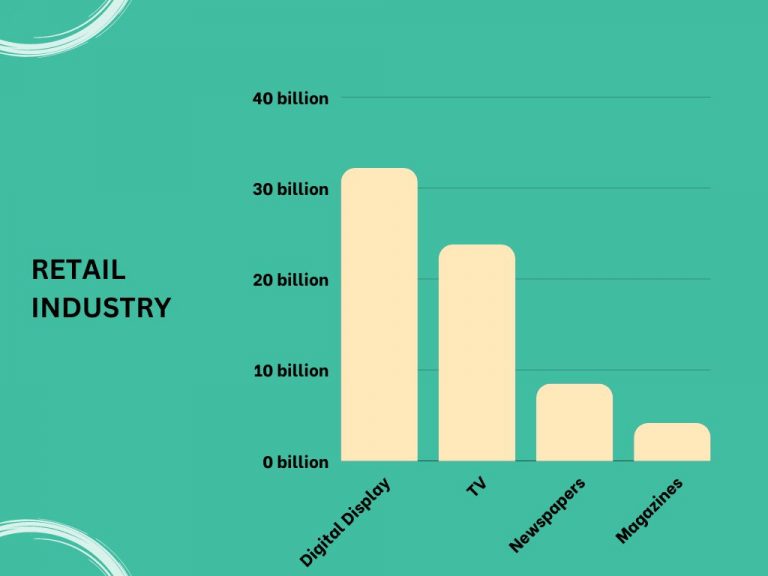
In the retail industry, digital display continues to be the highest form of advertising with an estimated spend of over $32 billion globally according to GroupM’s “This Year Next Year” report.
Automotive Industry
- TV: $16 billion
- Digital: $12 billion
- Radio: $5 billion
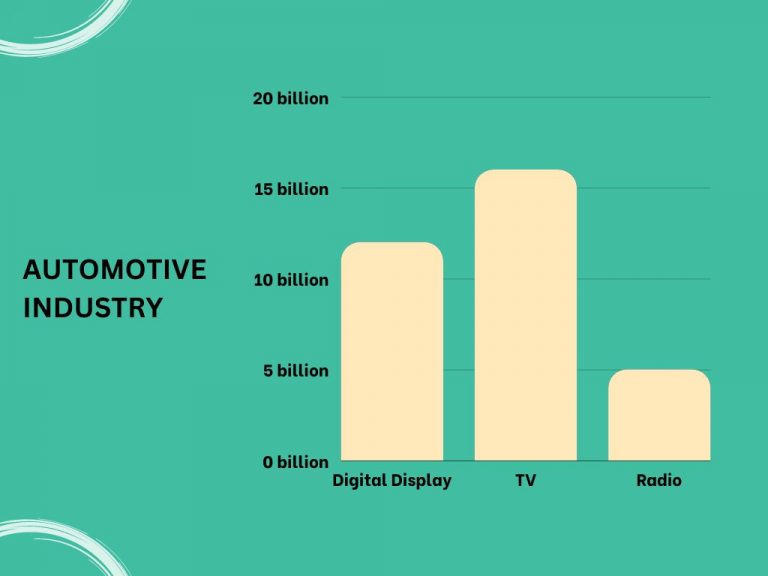
The automotive industry also saw significant growth in digital advertising spending which reached approximately $12 billion worldwide as reported by Zenith Media.
Consumer Packaged Goods (CPG) Industry:
- Digital Ads – 55%
- TV Ads – 26%
- Print Ads – 7%
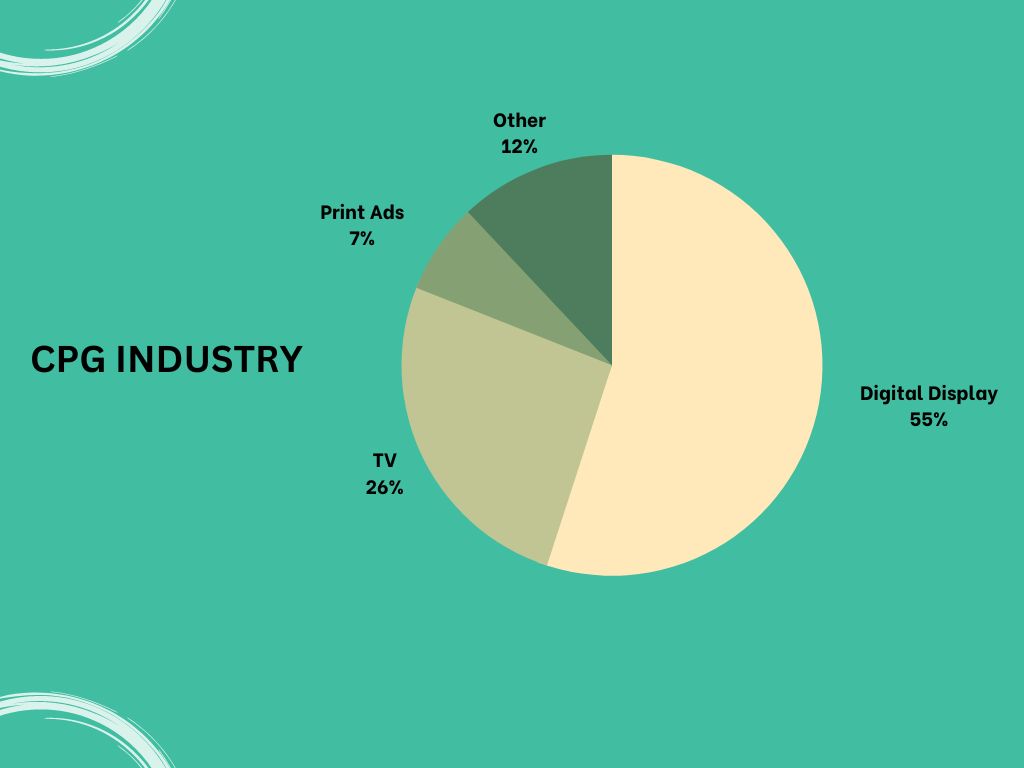
Zenith Media reports that Consumer Packaged Goods (CPG) are investing more than half their budgets into digital advertising this year, followed by TV at around 26%. Print advertisements have taken a backseat with only about seven percent of CPG advertising budgets being spent on print ads.
Financial Services Industry
- Digital: $23.35 billion
- TV: $14.93 billion
- Newspapers: $2.99 billion
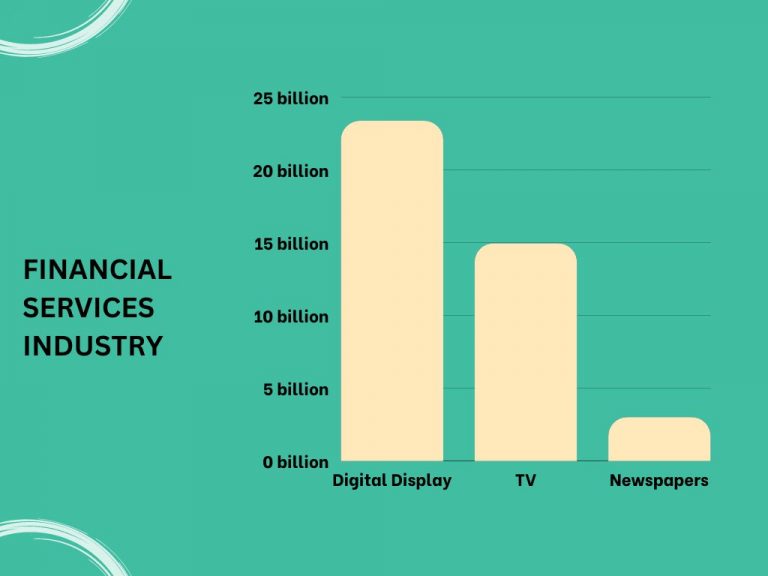
The financial services industry is also increasing its digital ad spend, which is expected to reach over $23 billion worldwide in 2021 according to GroupM’s report.
Healthcare Industry:
- Digital Ads – 22%
- TV Ads – 16%
- Print Ads – 4%
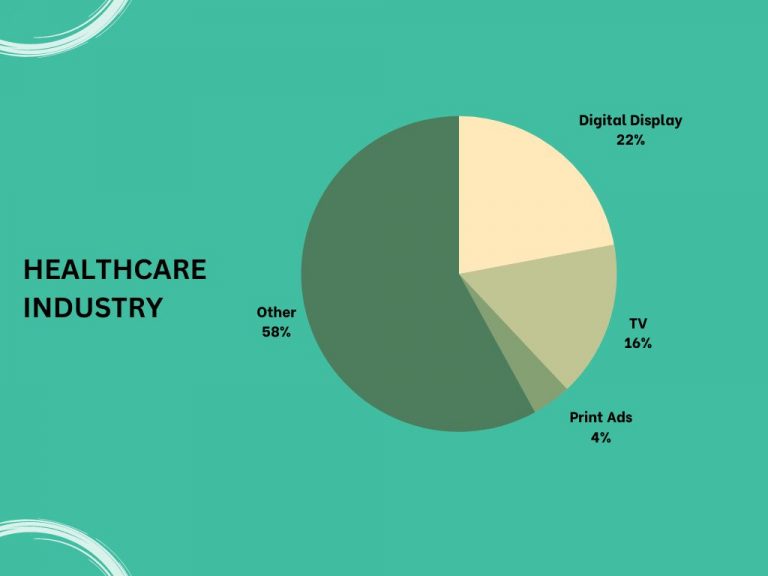
Zenith Media reports that the healthcare sector has increased its spending on digital advertising by around twenty-two percent this year, followed by TV at sixteen percent, and only four percent of their budget going toward print advertisements.
Ad Revenues & Benchmarks by Industry
In this section, we’ll explore the ad revenue and ROI averages seen across various industries, along with KPIs and benchmark goals to aid publishers in their decisions. We’ll also provide key performance indicators (KPIs) and benchmark goals for different types of advertising to help publishers make informed decisions.
Last Year’s Advertising Revenue Trends
According to eMarketer’s report, total ad revenues in 2023 showed a significant increase compared to previous years. The pandemic’s transformation of media consumption habits has caused companies to direct more resources toward digital advertising, such as social networks, podcasts, and video ads.
Total Ad Revenues by Industry
- Retail: The retail industry experienced a surge in ecommerce sales during the pandemic, resulting in an increased focus on digital marketing efforts. Retailers saw substantial returns from their investments in search engine marketing (SEM), display ads, and sponsored content.
- Healthcare: Healthcare providers turned toward telemedicine services due to COVID-19 restrictions. As a result, they invested more resources into online advertising campaigns targeting potential patients through channels like Google Ads and Facebook Ads.
- Tech: Tech companies continued their dominance over traditional industries when it came to ad spend ROI. They leveraged targeted programmatic campaigns across multiple platforms like LinkedIn or TikTok for maximum reach and engagement with their audience segments.
KPIs & Benchmark Goals for Different Types of Advertising
To measure your success with any given campaign type or platform accurately, you need relevant KPIs and benchmark goals. Here are some examples of KPIs and benchmarks for various advertising types:
- Display Ads: Click-through rate (CTR), cost per click (CPC), conversion rate, return on ad spend (ROAS). A good CTR benchmark is around 0.1%.
- Social Media Ads: Engagement rate, reach, impressions, conversions. For Facebook ads, a healthy engagement rate is between 1-3%, while Instagram’s average engagement rates hover around 3-6%.
- Email Marketing: Open rate, click-to-open ratio (CTOR), bounce rate, unsubscribe rate. Industry-standard open rates range from 15-25%, with CTORs averaging at about 10-20%.
To make the most out of your advertising efforts in today’s competitive landscape and achieve optimal ROI across industries and platforms alike requires constant monitoring of these metrics alongside strategic adjustments based on data-driven insights. By staying informed about industry trends and benchmarks like those mentioned above, you can stay ahead in the game when it comes to maximizing your ad spending.
By understanding these benchmarks, marketing teams can better set their goals for 2023 and optimize their advertising strategies. We will also provide key performance indicators (KPIs) that publishers should pay attention to when evaluating the success of their campaigns.
Automotive Industry
The automotive industry has been experiencing steady growth in digital ad spending, with an increase of 21.4% in 2023 compared to the previous year. The primary KPIs for this industry include click-through rates (CTR), cost per acquisition (CPA), and return on ad spend (ROAS). A good benchmark for CTR is around 0.90%, while CPA should be below $50, and ROAS above 400%.
Retail Industry
Digital advertising plays a crucial role in driving sales for retailers, especially amid the pandemic-induced shift toward e-commerce. US retail digital ad spending grew by 32.5% last year alone. Retailers often focus on metrics such as conversion rate, average order value (AOV), customer lifetime value (CLTV), and ROAS when measuring campaign success. An ideal conversion rate would be between 1%-2%, AOV at least $100-$150, CLTV over $500-$600, and ROAS above 300%.
Healthcare Industry
The healthcare sector has also been investing more in digital advertising, with a 14.2% increase in 2023 compared to the previous year. KPIs that matter for this industry include CTR, cost per lead (CPL), and cost per thousand impressions (CPM). A good benchmark for CTR is around 0.60%, CPL should be below $100-$150, and CPM under $10.
Travel & Tourism Industry
The travel industry has faced unprecedented challenges due to COVID-19 but is gradually recovering as restrictions ease worldwide. Digital ad spending in this sector saw an 8% growth rate last year after a significant decline in 2023. The primary KPIs for travel advertisers are click-through rates (CTR), conversion rates, and ROAS. An ideal benchmark would be a CTR of at least 0.50%, conversion rates above 1%-2%, and ROAS over 500%.
Financial Services Industry
In the financial services sector, digital ad spending increased by 15% in 2023 compared to the previous year as companies adapted their strategies during the pandemic period. Key performance indicators include CPA, CPL, and customer acquisition costs (CAC). Benchmarks for these metrics vary depending on specific products or services; however, generally speaking: CPA should range between $40-$80; CPL between $30-$60; and CAC below $200.
By understanding these industry-specific benchmarks and KPIs, marketing teams can set realistic goals for their 2023 advertising campaigns and make data-driven decisions to optimize their strategies. To remain competitive, it is essential for businesses to stay abreast of the changing digital ad landscape and its associated best practices.
Ad revenues and benchmarks by industry provide a comprehensive overview of what businesses should expect in 2023, allowing them to plan their advertising budgets accordingly. Moving on, the bottom line is about understanding how much money needs to be allocated for effective ad campaigns that will help companies reach their desired goals.
The Bottom Line
As we have seen throughout this article, understanding the advertising landscape and its trends is crucial for businesses to stay competitive in today’s market. By examining Zenith Media and GroupM reports on 2023 ad spending across industries and countries, as well as expert opinions on revenues and benchmarks, marketers can make informed decisions about their advertising strategies.
One of the key takeaways from these reports is that digital advertising continues to dominate over traditional methods. The pandemic has accelerated this shift, with more people spending time online than ever before. This trend highlights the importance of investing in digital channels such as social media, podcasts, retail media, and video ads to reach your target audience effectively.
- New industries: Emerging sectors like e-Commerce platforms (e.g., Amazon) or virtual reality spaces (Meta’s Metaverse) are experiencing rapid growth in ad spend due to increased consumer interest.
- Trends by country: Ad spending varies significantly between countries depending on factors such as economic health or local regulations; therefore, it’s essential for advertisers to tailor their campaigns accordingly.
- Benchmarks & KPIs: Monitoring industry-specific metrics helps publishers optimize their campaigns’ performance while ensuring they meet ROI goals set by experts within each sector.
44 Comments
Comments are closed